Chronicle of a Decompilation
I've been promising to do this for a while, so here goes. I have downloaded a small open source utility called extract_kyra which is part of the scummvm tools. It doesn't really matter what the utility does. In fact, I prefer not to know as it gives me an unfair advantage compared to, say, decompiling malware. What's important is that this tool is under the GPL, so it is permisible for me to decompile it. I will be writing a number of these posts that describe all the issues I've run into and the steps I've completed to produce the decompilation. I promise that I will not go and download the source code for this program until such time as I believe my decompilation is "complete".
 The first problem with decompiling this program is that Boomerang has failed to find main(). I can tell this because the load phase of the workflow does not list main as a found entrypoint, it only lists start. This is because this exe was compiled with MinGW and it would appear this is the first time anyone has tried to decompile an exe compiled with this compiler.
To find main I need to modify the loader to recognise the runtime support code that loads it. We do this with hand crafted patterns in the function GetMainEntrypoint() of each loader. In this case, the loader is Win32BinaryFile. Here's a diff of Win32BinaryFile.cpp from CVSWeb that adds my pattern. Essentially I just start at the program's entrypoint, follow the first relative call to get to __mingw_CRTStartup then main can be found by following the second last relative call before an indirect call to ExitProcess. I invented this pattern by studying the disassembly of the exe produced by IDA Pro, which has an extensive library of patterns for matching runtime code.
 Now that we have main we can move on to the decode phase of the workflow. Boomerang automatically follows all control paths from main and finds any procedures that are called. There are two kinds of procedures found: user procedures and library procedures. The former are the ones we're interested in decompiling, the later are typically dynamically linked to an exe. Library procedures provide a much needed source of type information. Therefore it is important to note any procedures which are unknown. For this decompilation we have a number of them. It is most effective to define signatures for these procedures before we continue the workflow.
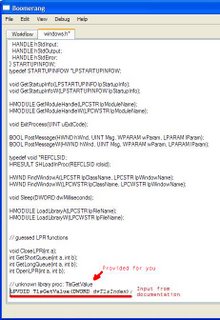 If we double click on one of the <unknown> library procedures in the list, Boomerang will open a new tab with a text editor that is open on an appropriate signature file. It is important to ensure that the signature file is appropriate, otherwise you might end up with the wrong kind of signature, but most of the time Boomerang gets it right. The editor is scrolled to the end of the file and a single line comment is provided to tell you what signature you need to add. In the screenshot I have added a signature for TlsGetValue, a win32 api which is the first unknown library procedure that the exe calls. Once you've added the signature, remember to remove the single line comment and save (CTRL-s). The Library Procedures list on the Workflow tab will immediately be updated. If it isn't, you've made a mistake. Continue adding signatures to the appropriate signature files until there are no <unknown> library procedures remaining.
 That done, we can now start the decompile phase of the workflow. Boomerang will output each user procedure as it is visited and the procedure will turn blue when processing is complete for that procedure. Library procedures are not shown as they require no processing.
I immediately see a problem. At some point I decided it would be nice if we recognised user procedures that solely contain a jump to a library procedure and give them a descriptive name; __imp_libproc. These days I think we can do even better and just replace the call to the __imp procedure with a direct call to the library procedure. Looking in frontend.cpp I see some code that starts with:
This really looks like what I want, but for some reason it isn't working. I think the problem lies in that check for getDestProc() == NULL. When I wrote this I was probably trying to solve a very specific problem and hadn't considered the general case. I think we always want to replace a call to a jump to a library procedure with a call to the library procedure. Removing that check gets rid of the __imp procedures.
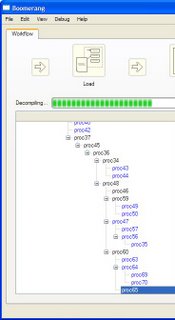 The decompilation is now proceeding smoothly. A good 26 procedures have been processed but Boomerang appears to have stalled on proc65. At present we can't interrupt the decompilation to see what is going on.. In the future I intend to implement a nice big STOP button that you can press to interrupt decompilation, but for now you can only stop the decompilation by closing the window.
One way to monitor the decompilation is to turn on verbose mode. This causes vast amounts of information to be dumped to a file called log in the output directory. Wading through all this debugging information can be a pain, and it's the primary reason why I wrote a GUI in the first place.
Another way is to attach an external debugger. Using conditional breakpoints you can step through the source code and see what the problem is. Similarly you can use profiling tools to determine what parts of the code are being executed the most.
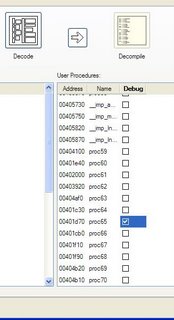 Before we resort to that, let's try the internal debugging. Close the Boomerang window and start it again. This time, we'll check the Enable debugging box on the Workflow tab before starting the load phase. In the decode phase we now see a checkbox next to each user procedure that has been found. Click on the header of the Debug column to toggle all the checkboxes to off and then toggle just the checkbox for proc65 to on. Proceed to the decompiling phase. The status bar will update rapidly as each procedure is processed until we get to proc65 when a new tab will open containing the RTL of that procedure. Decompilation is now paused and will remain so until you disable debugging through the Debug -> Enable menu option. You can temporarily restart the decompilation by pressing the Step button or selecting the Debug -> Step menu option. The decompilation will stop again once a single atom of processing has been completed or is ready to be initiated. The status bar will keep you informed of what is being done.
Pressing Step repeatedly we see the RTL updating rapidly. The button will go gray after each press indicating that the decompiler is busy and cannot be interrupted. When the decompiler is done processing a single step the button will be active again. Keep pressing the button until it doesn't become active again. The status bar reads: debugging proc65: after processing types. This gives us a clear indication of where in the decompilation of proc65 that we've reached. I find it particularly strange that it is an after message where we've stalled. Before this message I saw a processing constants message and these two messages indicate to me that we're in UserProc::middleDecompile. Looking at this part of the code I see some code that checks for indirect jumps that have been removed by propagation of constants. This is something that happens often in win32 programs. There is a log output message here but no similar message for the GUI. Checking the log indicates that this code has executed. I'll add new code here so the GUI gets a message as well.
Now that I have some idea of where to look I can attach my external debugger and look at what is happening. In this instance, it appears that Boomerang has discovered a switch statement. Decoding each arm of the switch statement is taking a significant amount of time (around a minute for each). There are 13 arms to the switch statement in this procedure, so it only looks like we've stalled. This is another good place to put a GUI message. Question is, why are we taking so long to decode these arms of the switch?
Well, it turns out a function I wrote to add the semantics of overlapping registers (PentiumFrontEnd::processOverlapped) did not take into account the possibility of redecoded procedures. As such, every time the decompiler decoded an arm of the switch statement it was adding more and more overlapped register assignments to the procedure. A simple flag on each BB to indicate that processing has been done and should not be redone is sufficient to fix this bug. We now decode past proc65 but it appears we've stopped on another procedure. On further inspection it's obvious this is just a GUI problem.. I need to show progress of the final decompilation steps as apparently they can take a long time.
Now the decompiler runs for a very long time. It processes every available procedure and begins the final phase of removing all the accumulated cruft from them. Everything appears to be going great until we hit proc48. During the remove redundant parameters analysis we get a stack overflow. On my windows machine this results in decompiler just disappearing. Attaching a debugger before the stack overflow occurs tells you it is a stack overflow but gives you no indication of where in your source code the stack overflow occurs. Thankfully we have the internal debugging and our log file to guide us. Here's a little exercised code path:
What's wrong here? Yes, that's right. We're ensuring dest isn't in the visited set and then we're recursing.. I believe the author of this code intended to call dest->checkForGainfulUse. That'd make more sense.
Removing redundant parameters is currently implemented using a fixed point algorithm (repeat until no change). It seems proc48 causes the decompiler to repeat a lot but eventually it does stop. Believe it not, the decompiling phase actually finished. On my machine it took about 20 solid minutes of processing. The whole time it sat on 100% until the very end and then, ironically, it went back to 98%. Clearly there's some improvements that can be done to the progress bar logic.
 We're now ready to enter the code generation phase of the workflow. All code is emitted to a single file in a subdirectory called extract_kyra in the the output directory. For some reason the progress bar only went up to 79%. Again, clearly some work I need to do there. Double clicking on any procedure name will open the output file. In the future I hope to make it scroll automatically to the selected procedure and provide all sorts of refactoring transformations to aid the user in making the output maintainable.
So what's the output look like? In a word: atrocious. You can look at it if you like (this page also has all future versions of my decompilation of this program). Most every procedure has too many parameters, too many locals and is missing types or even whole code sequences. This poor output is a result of bugs in the decompiler. Now that I've gotten to this stage I can start attacking each failure and, one bug at a time, improve the quality of the output. Then maybe the next large program I try will require less effort to decompile, and the next program will require less again, and so on. One day we'll have a click and go decompiler for machine code executables, but we're still a long way off.
 The first problem with decompiling this program is that Boomerang has failed to find main(). I can tell this because the load phase of the workflow does not list main as a found entrypoint, it only lists start. This is because this exe was compiled with MinGW and it would appear this is the first time anyone has tried to decompile an exe compiled with this compiler.
To find main I need to modify the loader to recognise the runtime support code that loads it. We do this with hand crafted patterns in the function GetMainEntrypoint() of each loader. In this case, the loader is Win32BinaryFile. Here's a diff of Win32BinaryFile.cpp from CVSWeb that adds my pattern. Essentially I just start at the program's entrypoint, follow the first relative call to get to __mingw_CRTStartup then main can be found by following the second last relative call before an indirect call to ExitProcess. I invented this pattern by studying the disassembly of the exe produced by IDA Pro, which has an extensive library of patterns for matching runtime code.
 Now that we have main we can move on to the decode phase of the workflow. Boomerang automatically follows all control paths from main and finds any procedures that are called. There are two kinds of procedures found: user procedures and library procedures. The former are the ones we're interested in decompiling, the later are typically dynamically linked to an exe. Library procedures provide a much needed source of type information. Therefore it is important to note any procedures which are unknown. For this decompilation we have a number of them. It is most effective to define signatures for these procedures before we continue the workflow.
 If we double click on one of the <unknown> library procedures in the list, Boomerang will open a new tab with a text editor that is open on an appropriate signature file. It is important to ensure that the signature file is appropriate, otherwise you might end up with the wrong kind of signature, but most of the time Boomerang gets it right. The editor is scrolled to the end of the file and a single line comment is provided to tell you what signature you need to add. In the screenshot I have added a signature for TlsGetValue, a win32 api which is the first unknown library procedure that the exe calls. Once you've added the signature, remember to remove the single line comment and save (CTRL-s). The Library Procedures list on the Workflow tab will immediately be updated. If it isn't, you've made a mistake. Continue adding signatures to the appropriate signature files until there are no <unknown> library procedures remaining.
 That done, we can now start the decompile phase of the workflow. Boomerang will output each user procedure as it is visited and the procedure will turn blue when processing is complete for that procedure. Library procedures are not shown as they require no processing.
 I immediately see a problem. At some point I decided it would be nice if we recognised user procedures that solely contain a jump to a library procedure and give them a descriptive name; __imp_libproc. These days I think we can do even better and just replace the call to the __imp procedure with a direct call to the library procedure. Looking in frontend.cpp I see some code that starts with:
// Is the called function a thunk calling a library function?
// A "thunk" is a function which only consists of: "GOTO library_function"
if( call && call->getDestProc() == NULL && call->getFixedDest() != NO_ADDRESS ) {
This really looks like what I want, but for some reason it isn't working. I think the problem lies in that check for getDestProc() == NULL. When I wrote this I was probably trying to solve a very specific problem and hadn't considered the general case. I think we always want to replace a call to a jump to a library procedure with a call to the library procedure. Removing that check gets rid of the __imp procedures.
 The decompilation is now proceeding smoothly. A good 26 procedures have been processed but Boomerang appears to have stalled on proc65. At present we can't interrupt the decompilation to see what is going on.. In the future I intend to implement a nice big STOP button that you can press to interrupt decompilation, but for now you can only stop the decompilation by closing the window.
 One way to monitor the decompilation is to turn on verbose mode. This causes vast amounts of information to be dumped to a file called log in the output directory. Wading through all this debugging information can be a pain, and it's the primary reason why I wrote a GUI in the first place.
Another way is to attach an external debugger. Using conditional breakpoints you can step through the source code and see what the problem is. Similarly you can use profiling tools to determine what parts of the code are being executed the most.
 Before we resort to that, let's try the internal debugging. Close the Boomerang window and start it again. This time, we'll check the Enable debugging box on the Workflow tab before starting the load phase. In the decode phase we now see a checkbox next to each user procedure that has been found. Click on the header of the Debug column to toggle all the checkboxes to off and then toggle just the checkbox for proc65 to on. Proceed to the decompiling phase. The status bar will update rapidly as each procedure is processed until we get to proc65 when a new tab will open containing the RTL of that procedure. Decompilation is now paused and will remain so until you disable debugging through the Debug -> Enable menu option. You can temporarily restart the decompilation by pressing the Step button or selecting the Debug -> Step menu option. The decompilation will stop again once a single atom of processing has been completed or is ready to be initiated. The status bar will keep you informed of what is being done.
Pressing Step repeatedly we see the RTL updating rapidly. The button will go gray after each press indicating that the decompiler is busy and cannot be interrupted. When the decompiler is done processing a single step the button will be active again. Keep pressing the button until it doesn't become active again. The status bar reads: debugging proc65: after processing types. This gives us a clear indication of where in the decompilation of proc65 that we've reached. I find it particularly strange that it is an after message where we've stalled. Before this message I saw a processing constants message and these two messages indicate to me that we're in UserProc::middleDecompile. Looking at this part of the code I see some code that checks for indirect jumps that have been removed by propagation of constants. This is something that happens often in win32 programs. There is a log output message here but no similar message for the GUI. Checking the log indicates that this code has executed. I'll add new code here so the GUI gets a message as well.
Now that I have some idea of where to look I can attach my external debugger and look at what is happening. In this instance, it appears that Boomerang has discovered a switch statement. Decoding each arm of the switch statement is taking a significant amount of time (around a minute for each). There are 13 arms to the switch statement in this procedure, so it only looks like we've stalled. This is another good place to put a GUI message. Question is, why are we taking so long to decode these arms of the switch?
Well, it turns out a function I wrote to add the semantics of overlapping registers (PentiumFrontEnd::processOverlapped) did not take into account the possibility of redecoded procedures. As such, every time the decompiler decoded an arm of the switch statement it was adding more and more overlapped register assignments to the procedure. A simple flag on each BB to indicate that processing has been done and should not be redone is sufficient to fix this bug. We now decode past proc65 but it appears we've stopped on another procedure. On further inspection it's obvious this is just a GUI problem.. I need to show progress of the final decompilation steps as apparently they can take a long time.
Now the decompiler runs for a very long time. It processes every available procedure and begins the final phase of removing all the accumulated cruft from them. Everything appears to be going great until we hit proc48. During the remove redundant parameters analysis we get a stack overflow. On my windows machine this results in decompiler just disappearing. Attaching a debugger before the stack overflow occurs tells you it is a stack overflow but gives you no indication of where in your source code the stack overflow occurs. Thankfully we have the internal debugging and our log file to guide us. Here's a little exercised code path:
bool UserProc::checkForGainfulUse(Exp* bparam, ProcSet& visited) {
visited.insert(this); // Prevent infinite recursion
       ...
if (visited.find(dest) == visited.end() &&
  checkForGainfulUse(lloc, visited))
 return true;
What's wrong here? Yes, that's right. We're ensuring dest isn't in the visited set and then we're recursing.. I believe the author of this code intended to call dest->checkForGainfulUse. That'd make more sense.
Removing redundant parameters is currently implemented using a fixed point algorithm (repeat until no change). It seems proc48 causes the decompiler to repeat a lot but eventually it does stop. Believe it not, the decompiling phase actually finished. On my machine it took about 20 solid minutes of processing. The whole time it sat on 100% until the very end and then, ironically, it went back to 98%. Clearly there's some improvements that can be done to the progress bar logic.
 We're now ready to enter the code generation phase of the workflow. All code is emitted to a single file in a subdirectory called extract_kyra in the the output directory. For some reason the progress bar only went up to 79%. Again, clearly some work I need to do there. Double clicking on any procedure name will open the output file. In the future I hope to make it scroll automatically to the selected procedure and provide all sorts of refactoring transformations to aid the user in making the output maintainable.
So what's the output look like? In a word: atrocious. You can look at it if you like (this page also has all future versions of my decompilation of this program). Most every procedure has too many parameters, too many locals and is missing types or even whole code sequences. This poor output is a result of bugs in the decompiler. Now that I've gotten to this stage I can start attacking each failure and, one bug at a time, improve the quality of the output. Then maybe the next large program I try will require less effort to decompile, and the next program will require less again, and so on. One day we'll have a click and go decompiler for machine code executables, but we're still a long way off.


Comments
Post a Comment